Selected Chart Pattern
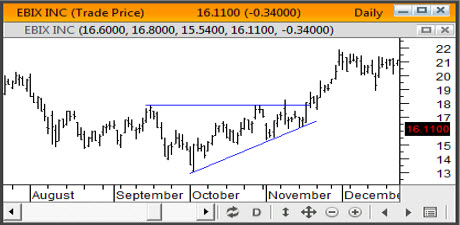
Ascending Triangle
In an ascending triangle, one trendline is drawn horizontally at a level that has historically prevented the price from heading higher, while the second trendline connects a series of increasing troughs. Traders enter into long positions when the price of the asset breaks above the top resistance. An ascending triangle is generally considered to be a continuation pattern, meaning that it is usually found amid a period of consolidation within an uptrend. Once the breakout occurs, buyers will aggressively send the price of the asset higher, usually on high volume. The most common price target is generally set to be equal to the entry price plus the vertical height of the triangle.